 Google Analytics. If your company has a website and you have some responsibility for sales, profit, content or customer acquisition, you’ve probably been told more than once to install, track, or look at it. Google Analytics is useful; however, it isn’t overly user-friendly, so it takes a little getting used to. There are other resources that can instruct you how to install Google analytics, so this article will highlight six reports that can start you on the path to using Analytics. For purposes of simplicity, we’ll suggest different reports in Google’s broad groupings – audience, technology acquisition and behavior.
Before diving into the reports, take a look at your Google Analytics screen. You’ll notice menu options and filter are to the left. There are directional arrows to the far left, which when pointed sideways indicate that there is the option of drilling down further. Click on any one and you’ll notice there are further drill down options. This is your “top level” navigation to become accustomed to.
DEMOGRAPHIC DISTINCTIONS
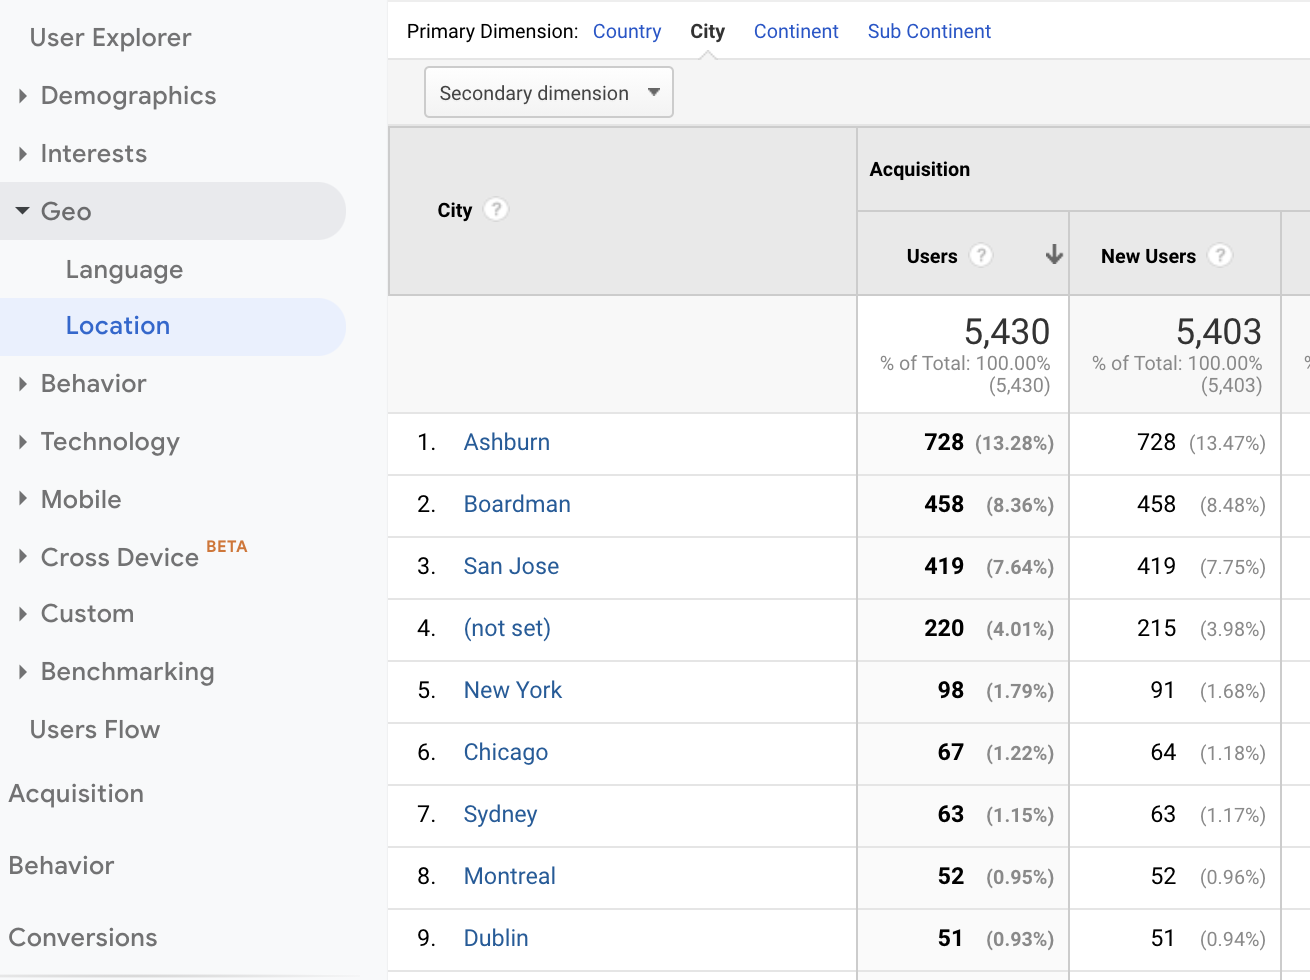
A website can be accessed from virtually anywhere in the world. While this gives you a global platform, many businesses are local, regional or national in nature. Suppose you ran a dry-cleaning business in Anytown, USA. Since most of your customers are likely to be local residents or perhaps temporary lodgers, it would be more relevant to you to attract web traffic from your home town or somewhat contiguous municipalities. Looking at the left-hand controls, sequence your selection to be Audience-Geo-Location. The default Primary Dimension is Country, but you could select City to drill down one more level. Having assessed where your traffic is coming from geographically, you can decide if your site is being consumed as expected or if your geographic focus is working.
It is often said that it is easier to retain a customer compared to attracting a new one. A report that will give you some insights here is Audience-Behavior-New vs Returning. One thing we typically will take notice of is “quality” metrics of traffic. Typically, this report will show bounce rate, pages per session and average session duration are usually better for returning visitors compared to new visitors.

TECHNICAL INSIGHT
Take a look at Audience-Mobile-Overview. It will indicate what proportion of site visitors accesses your website via desktop, mobile or tablet. This should inform how you design the site, the type of promotions you might offer or how your customers are engaging.
Behavior-Site Content-Site Speed-Speed Suggestions demonstrate the frequency a page is viewed and the average load time. Suppose your home page took ten seconds to load. For that page or other pages that took too long to render, you could have them analyzed to determine potential ways to speed up the page delivery and improve user experience.

APPRECIATING SOURCE AND BEHAVIOR
Acquisition-All Traffic-Channels delineates your traffic source. There are nine default sources – Organic, Social, Email, Affiliate, Direct, Referral, Paid Search, Display Advertising, Other Advertising, and Unavailable / Other. This would be one way to gauge the effectiveness of your search engine optimization, social posts or email campaigns, amongst others. For example, if you posted to Facebook or some other social media every day one month but not at all the following month, would it move the needle in terms of this traffic channel? If so, “wash, rinse, repeat.” If not, adjust the content or frequency or audience targeting of your posts.
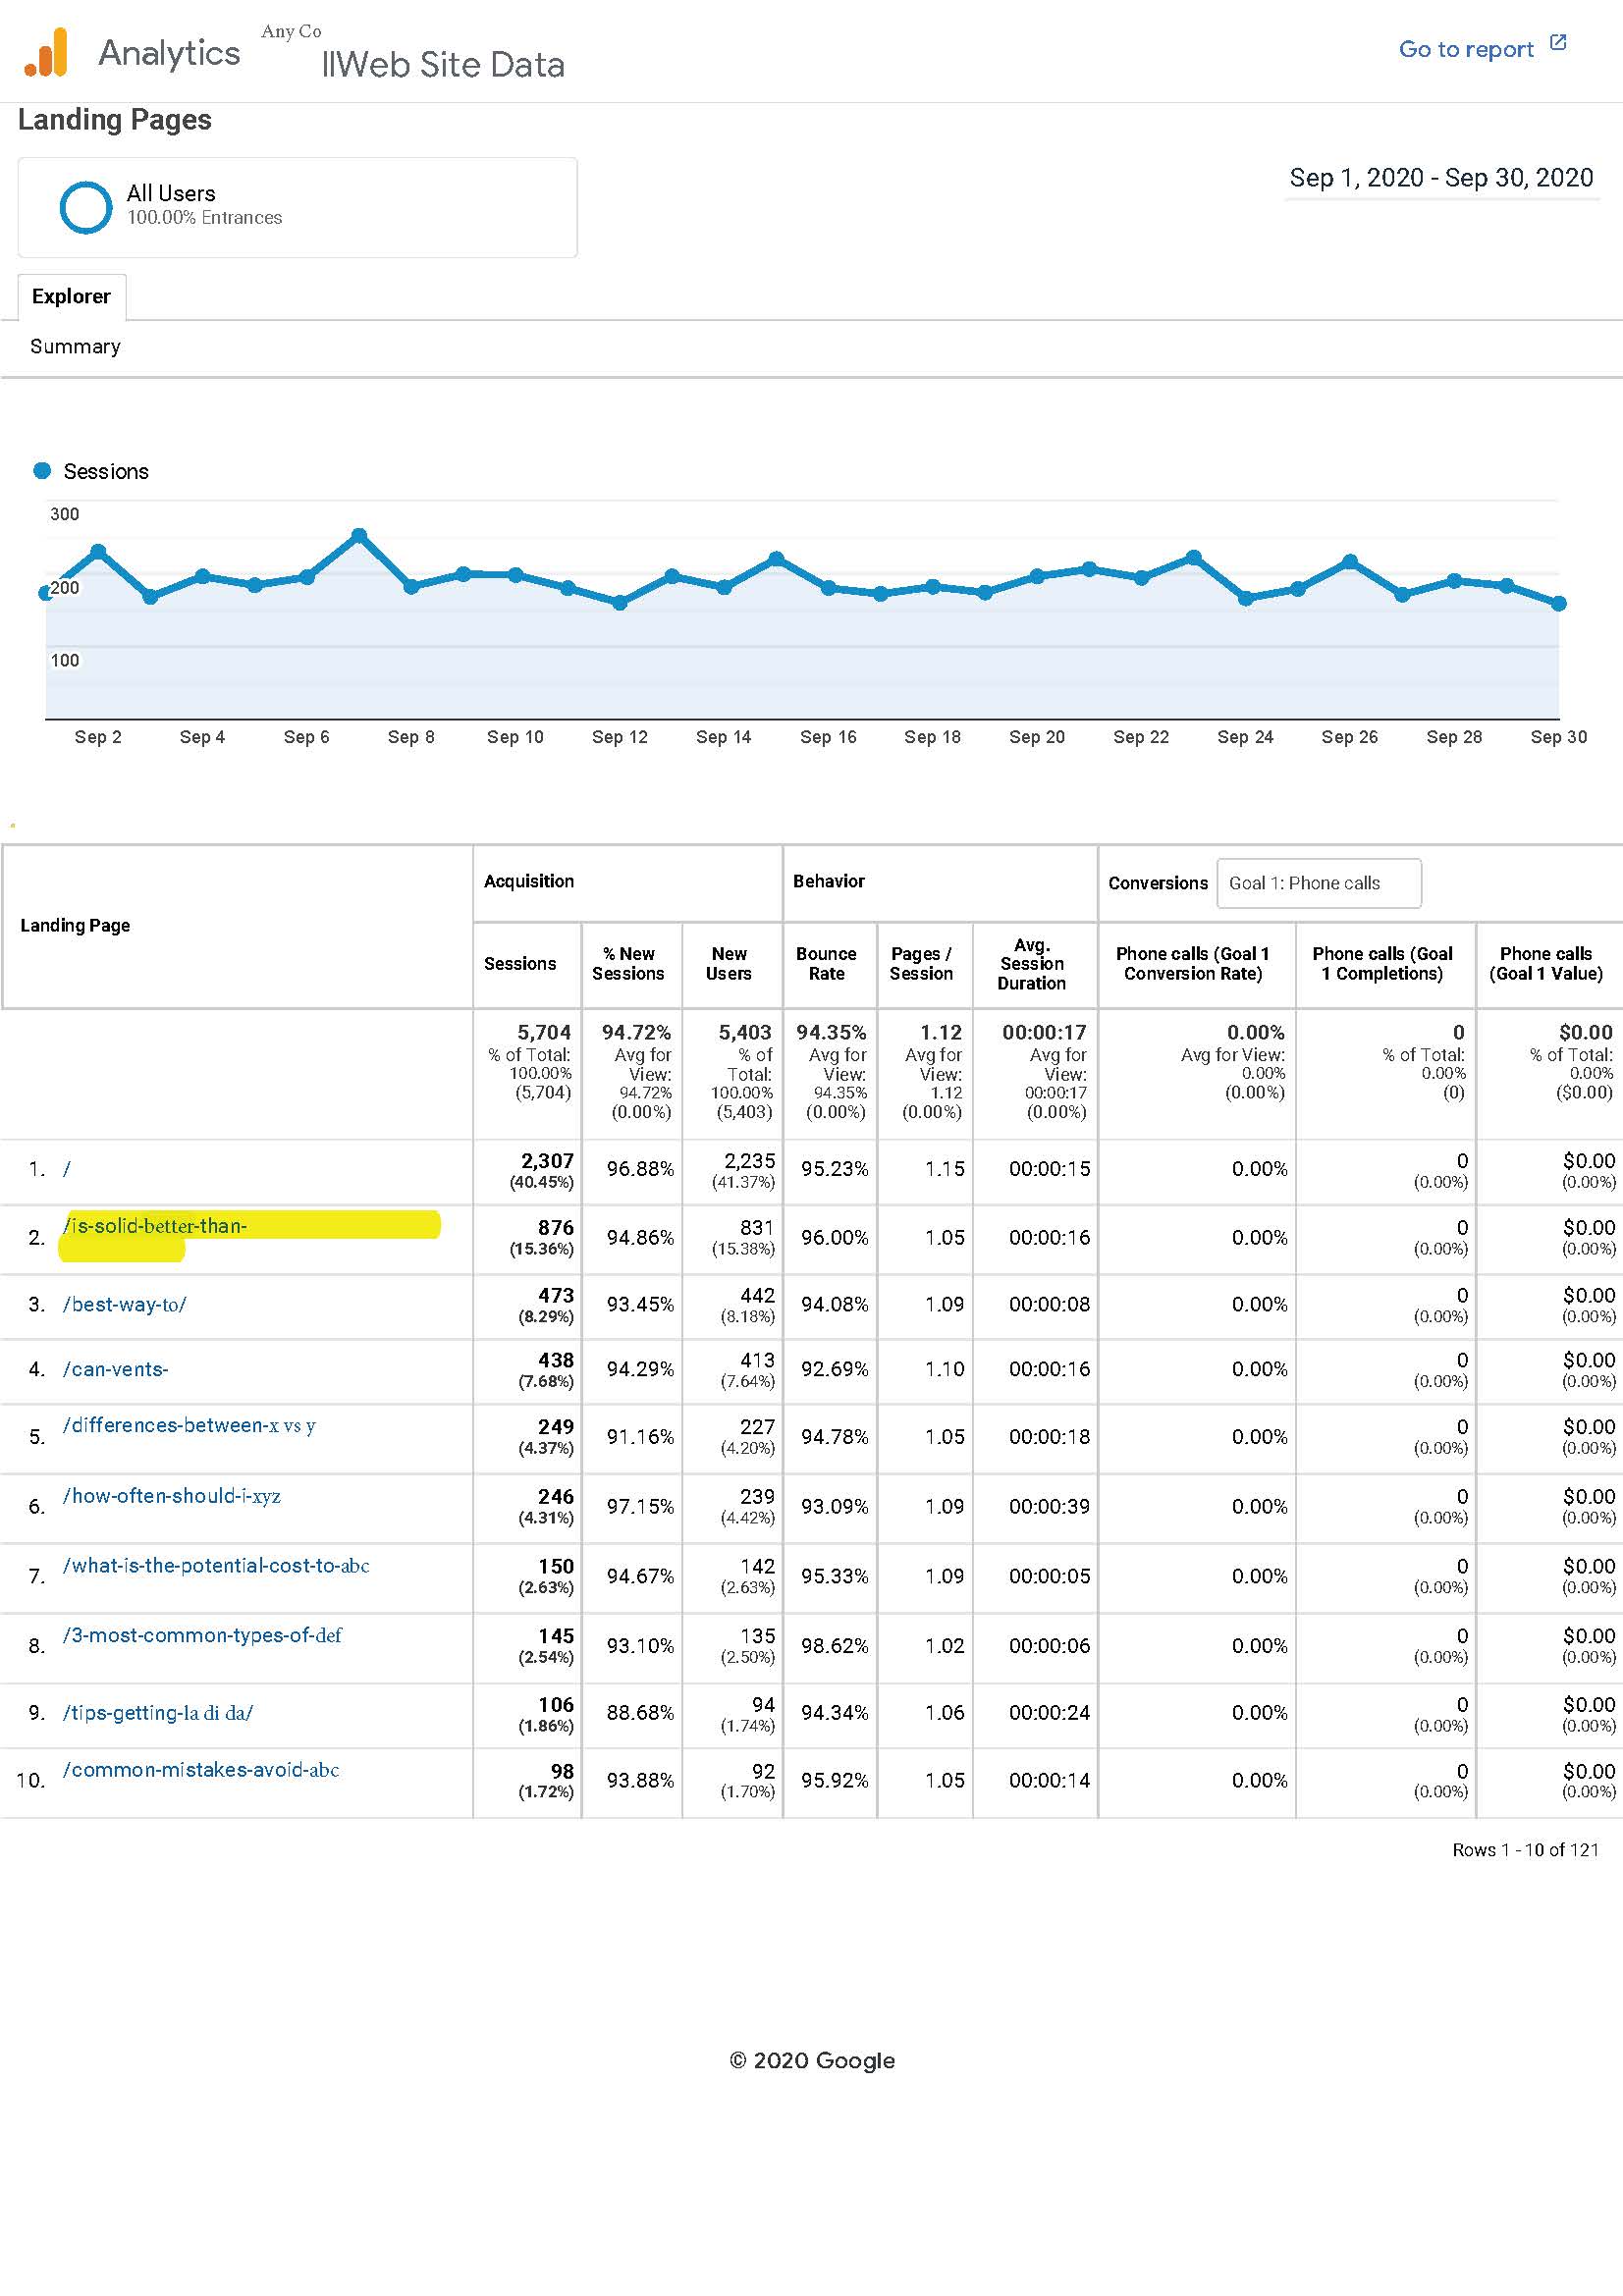
Behavior-Site Content-Landing Pages would indicate which of your webpages drew the most traffic and the average duration on that page. You might determine which pages on your site or which topics draw the most interest. You might identify some seasonality to your business. These types of insights might inform the timing or the content of future blog posts.
OBJECTIVES & GOAL SETTING
What constitutes success for an e-commerce site might be vastly different from, a site for a Certified Public Accounting firm. The former wants conversion reflected in product purchases while the latter might want to collect email names or have appointments booked. As you become more experienced and advanced in Google Analytics, you could set up goals, create custom reports, add tracking codes to your email campaigns, attach tracking to your shopping cart, etc. It isn’t for everyone, but the main point is there’s a load of information. If you start out with some basic steps, your command of the tool improves. If you really don’t have a feel for it, hire a professional to start listening to the unspoken signals your site visitors are whispering to you. Interpreting these messages will improve your audience overview which will better inform your content, programming, page speed, and site design. Want to continue the conversation? Feel free to reach out at (914) 348-9467 or [email protected].
Stay Connected